The world is adopting renewable energy at an unprecedented rate, and solar energy is one of the best.
In 2020, global energy demand fell by 4.5%, but despite this, progress in renewable energy technology is still encouraging. Renewable energy has seen strong growth across the board, with solar energy taking the lead, with an installed capacity of 127GW in 2020, the highest annual capacity expansion ever.
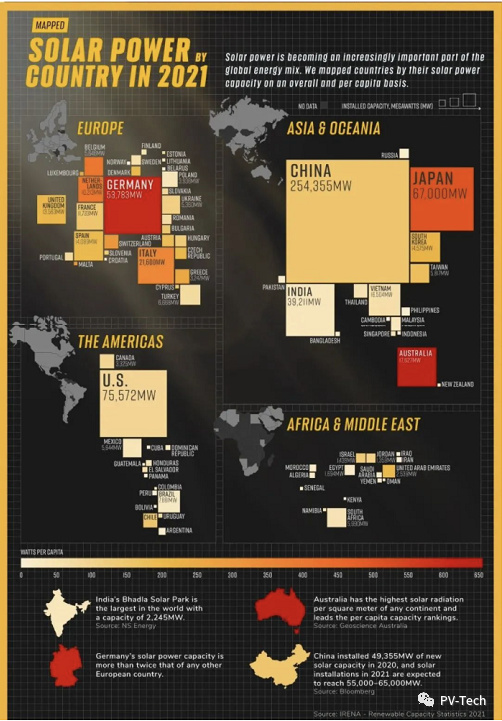
The above infographic uses data from the International Renewable Energy Agency (IRENA) to map the solar power capacity of various countries in 2021, including solar photovoltaic (PV) and concentrated solar power capacity.
China is the undisputed leader in installed solar capacity, with more than 35% of global capacity. More importantly, this country shows no signs of slowing down. The scale of wind and solar projects under development in China is the largest in the world, which will increase its clean energy capacity by another 400,000 MW.
Following China is the United States. In the first three months of 2021, the United States has installed another 50,000 MW photovoltaic projects. Recently, the photovoltaic capacity of the United States exceeded 100,000 MW. In the past ten years, the average annual growth rate of solar energy in the United States was 42%, which is impressive. Policies such as solar investment tax credits provide 26% tax credits for household and commercial solar systems, driving the industry forward.
Australia’s solar power generation is only a small part of China, but due to its relatively small population, only 26 million, it ranks among the top per capita. The amount of solar radiation on the Australian continent is the highest of all continents. Currently, more than 30% of Australian households have rooftop solar photovoltaic systems.